| Creating Drill-Down Graphs in HTML |
| Complete Program and
Output |
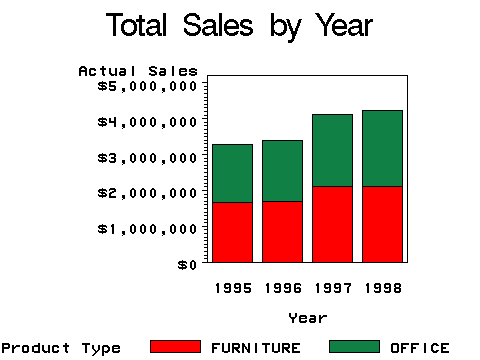
| Select the bars in the chart below to view yearly sales by quarter. |
totsales.html |
 |
  |
|
Copyright © 2002 SAS Institute Inc.,
Cary, NC, USA. All rights reserved.