| Creating Plots | |
| Overlaying Plots |
| In this lesson so far, you have created one plot at a time in your PROC GPLOT steps. You can also produce multiple plots on a single set of axes by specifying multiple plot requests and the OVERLAY option in the PLOT statement. |
General form, simple PLOT statement for overlaid
plots:
where
|
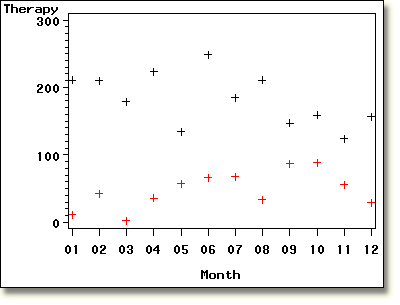
| The PLOT statement below, for example, plots the number of patients in exercise therapy by month and the number of treadmill tests by month. The OVERLAY option overlays the plots on the same set of axes. |
     proc gplot data=clinic.totals2000;
          plot therapy*month treadmill*month / overlay;
     run;      |<--pair1-->| |<---pair2--->|
The PROC GPLOT step creates the overlaid plots below. Note that the vertical axis is labeled with the name of the first Y variable. |

| If the OVERLAY option were not specified, each plot request would generate a separate graph. |
  |
|
Copyright © 2002 SAS Institute Inc.,
Cary, NC, USA. All rights reserved.