| Creating Plots | |
| Enhancing Plots |
| Specifying Connecting Lines
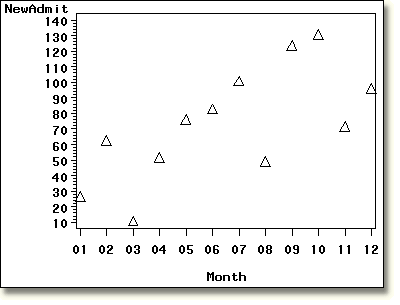
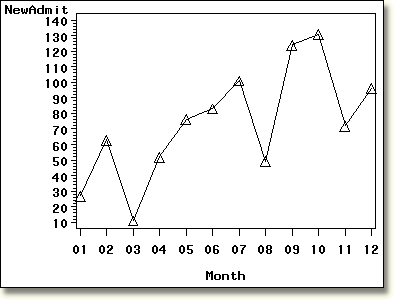
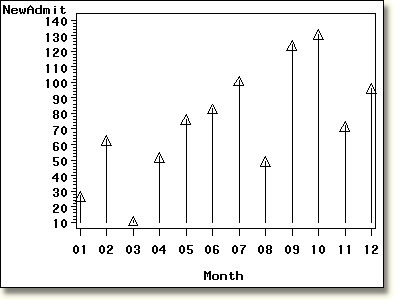
To specify whether or not to connect plotted points, you use the INTERPOL= (or I=) option in the SYMBOL statement. Connecting lines can be straight lines, smoothed lines, or vertical lines drawn from plotted points to a horizontal line at zero or the minimum value on the Y axis. Possible values include NONE, JOIN, NEEDLE, SPLINE, HILO, STD, and more. |
| Examples
symbol1 value=triangle interpol=none; |
symbol1 value=triangle interpol=join; |
symbol1 value=triangle interpol=needle; |
|
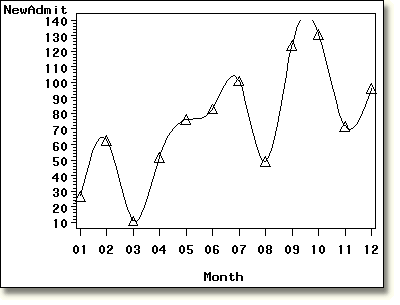
symbol1 value=none interpol=spline; |
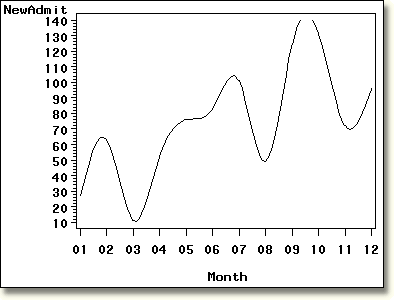
| If the interpolation goes beyond the minimum or maximum values, that part of the interpolation will not be shown on the graph (see the second and third graphs above for examples). To correct this problem, you can expand the axis range using the HAXIS= and VAXIS= options. |
  |
|
Copyright © 2002 SAS Institute Inc.,
Cary, NC, USA. All rights reserved.