| Creating Plots | |
| Enhancing Plots |
| Specifying Color
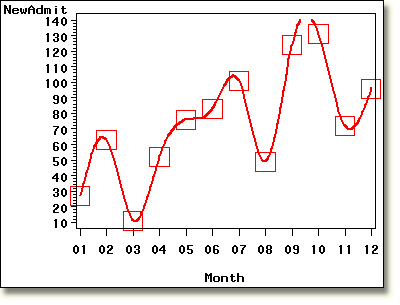
You can also specify color for plotting symbols and interpolated lines using the COLOR= (or C=) option. This SYMBOL statement specifies a red plotting symbol and line: symbol1 value=square interpol=spline
height=1 cm width=2.5 color=red;
This plot shows the effect of the COLOR=RED option. |

| Important Tip: Specifying Color for Multiple Plot
Lines
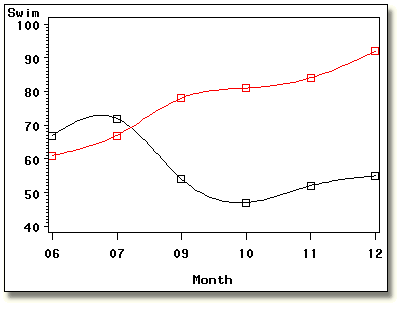
In general, it is easier to relate SYMBOL statements to plot lines if you specify a color for each SYMBOL statement. If you do not, you may get unexpected results, as illustrated by the example below. You might expect the following program to produce two plot lines, one with square plotting symbols and one with triangle plotting symbols. However, as you can see in the resulting plot, both plot lines have square plotting symbols.
     symbol1 interpol=spline value=square;
     symbol2 interpol=spline value=triangle;
     proc gplot data=clinic.therapy1999;
        plot swim*month aerclass*month/overlay;
     run;
|

| Here's why the result is not what you may have expected: if you don't
specify the COLOR= option in a SYMBOL statement, SAS/GRAPH software
cycles that SYMBOL statement through the current colors list for
your device before using the next SYMBOL statement. This can result
in one SYMBOL statement spawning a large number of plot definitions. In this
case, the SYMBOL1 statement was rotated through the first two colors in the
color list, black and red. The SYMBOL2 statement was not needed and so was
not used.
|
  |
|
Copyright © 2002 SAS Institute Inc.,
Cary, NC, USA. All rights reserved.