| Creating Bar and Pie Charts |
| Summarizing a Variable within
Categories |
| In addition to specifying a particular statistic for your chart, you may want to summarize one variable within categories defined by a second variable. You can use the SUMVAR= option to summarize a variable within categories. |
General form, PROC GCHART step with SUMVAR=
option:
where the values of summary-variable are
summarized for each unique value of
|
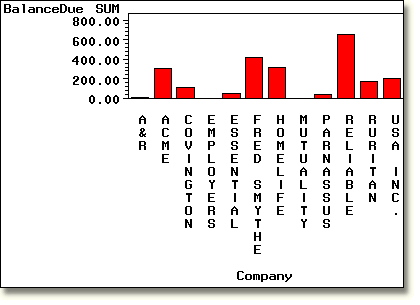
| Example
The GCHART step below specifies the summary variable
     proc gchart data=clinic.insure;
        vbar company / sumvar=balancedue;
     run;
|
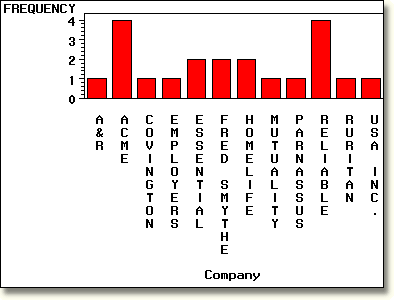
Without the summary variable, the GCHART procedure displays
the frequency of the chart variable Company (the number of people
who have a policy with each company).
     proc gchart data=clinic.insure;
        vbar company;
     run;
|
  |
|
Copyright © 2002 SAS Institute Inc.,
Cary, NC, USA. All rights reserved.