| Creating Bar and Pie Charts |
| Summarizing a Variable within
Categories |
| You've seen how to use the TYPE= and SUMVAR= options individually. You can also combine the SUMVAR= option with TYPE=MEAN to request the average of the values of the summary variable for each unique value of the chart variable. |
| To use TYPE= MEAN, you must also use the SUMVAR= option. |
Example
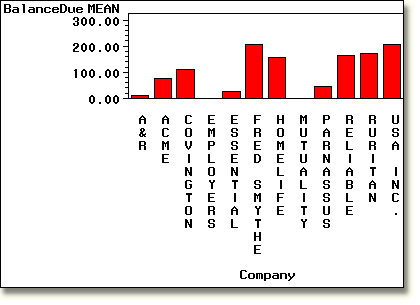
This GCHART step specifies a chart variable ( proc gchart data=clinic.insure;
vbar company / sumvar=balancedue type=mean;
run;
|
The GCHART step below is the same as the example above,
except that it specifies a pie chart rather than a vertical bar chart.
     proc gchart data=clinic.insure;
        pie company / sumvar=balancedue type=mean;
     run;
|
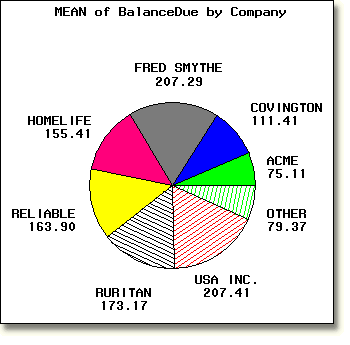
| The pie slices still represent the average of each company's
balance due amounts. But unlike the vertical bar chart, not every company
appears in the pie chart. The companies Employers and
Mutuality do not appear because they have no balance due. The companies
A&R, Essential, and Parnassus do not appear
individually because they have been automatically combined in the category
OTHER.
As shown below, messages in the Log window describe the OTHER slice. |
|
|
  |
|
Copyright © 2002 SAS Institute Inc.,
Cary, NC, USA. All rights reserved.