| Creating Bar and Pie Charts |
| Selecting
Observations |
| In this lesson so far, you have created charts using all
of the observations in the data set. But you may want to create a chart that
displays statistics on a subset of your data.
If you took the lesson on PROC PRINT or PROC TABULATE, you learned to use the WHERE statement to select observations based on certain conditions, as in the examples below. |
     proc print data=clinic.admit;
        where actlevel in ('HIGH','LOW');
     run;
     proc tabulate data=clinic.stress2;
        var maxhr rechr resthr;
        table max*(maxhr rechr resthr);
        where rechr>120;
     run;
|
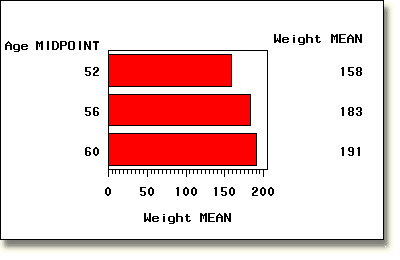
The WHERE statement works the same with PROC GCHART as it
does with other PROC steps. For example, the bar chart below summarizes only
observations where the value of Age is greater than 50. To select
these observations, you use this WHERE statement:
     proc gchart data=clinic.admit;
        hbar age / sumvar=weight type=mean;
        where age>50;
     run;
|

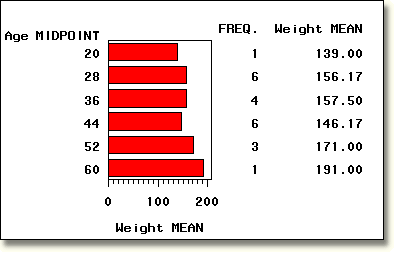
| Compare the chart above to the one below, which was produced without the WHERE statement. Notice that the automatically determined age midpoints have changed. |
     proc gchart data=clinic.admit;
        hbar age / sumvar=weight type=mean;
     run;
|

  |
|
Copyright © 2002 SAS Institute Inc., Cary, NC, USA. All rights reserved.