| Enhancing and Exporting Charts and Plots |
| Specifying Titles and
Footnotes |
As with other SAS procedures, you can use
TITLE and
FOOTNOTE statements to enhance SAS/GRAPH
output, as shown in the example below.
     title1 'Total Revenue for Males';
     footnote1 'For March 1-15';
     proc gchart data=clinic.admit;
        hbar actlevel / sumvar=fee
             patternid=midpoint sum;
        where sex='M';
        label actlevel='Activity Level';
        format fee dollar5.;
     run;
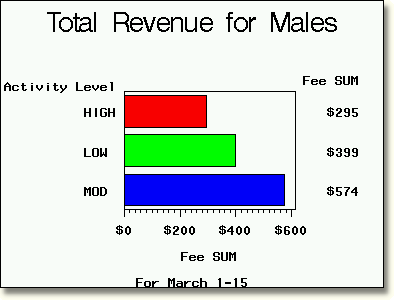
This program produces a bar chart with the title Total Revenue for Males and the footnote For March 1-15. |

  |
|
Copyright © 2002 SAS Institute Inc., Cary, NC, USA. All rights reserved.