| Enhancing and Exporting Charts and Plots |
| Specifying Titles and
Footnotes |
| Default Values
When you specify options in the TITLE and FOOTNOTE statements, it's helpful to know the default option settings. The table below shows the default values for the COLOR=, FONT=, and HEIGHT= options. |
| Option | TITLE1 Defaults | Other Title and Footnote Defaults |
| COLOR= |
First default color for the graphics device |
First default color forthe graphics device |
| FONT= | SWISS | Hardware character set |
| HEIGHT= | 2 CELLS | 1 CELL |
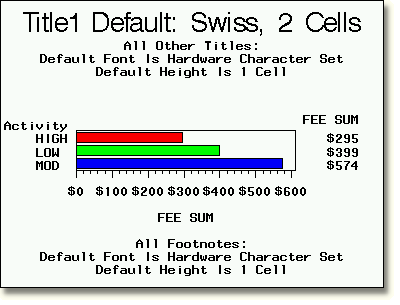
| The illustration below shows the default title and footnote appearance. Notice that title and footnote space is allocated first, which reduces the area available for the chart or plot. |

Here is the code that produced the graph above. title1 'Title1 Default: Swiss, 2 Cells';
title2 'All Other Titles:';
title3 'Default Font Is Hardware Character Set';
title4 'Default Height Is 1 Cell';
footnote1 'All Footnotes:';
footnote2 'Default Font Is Hardware Character Set';
footnote3 'Default Height Is 1 Cell';
footnote4 ' ';
proc gchart data=clinic.admit;
hbar actlevel / sumvar=fee
patternid=midpoint sum;
where sex='M';
label actlevel='Activity';
format fee dollar5.;
run;
|
|
Copyright © 2002 SAS Institute Inc., Cary, NC, USA. All rights reserved.