| Enhancing and Exporting Charts and Plots |
| Controlling VBAR
Statistics |
| Enhancing and Exporting Charts and Plots |
| Controlling VBAR
Statistics |
Next, let's consider vertical bar charts. By default, only the statistic
frequency is displayed for VBAR charts (and VBAR3D charts,
which are three-dimensional vertical bar charts). To display additional
statistics, you can use
|
General form, VBAR and VBAR3D statements for specifying
additional statistics:
where statistic indicates the statistic of the chart variable to be displayed.
|
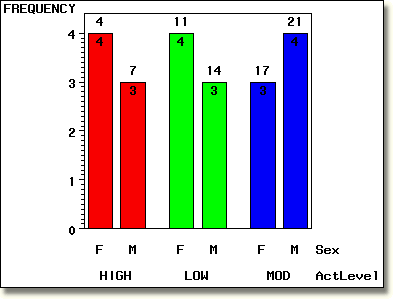
This example shows a VBAR statement which specifies that the statistic
FREQ (frequency) be displayed inside the bars and the statistic CFREQ (cumulative
frequency) be displayed above the bars.
        proc gchart data=clinic.admit;
           vbar sex / group=actlevel
                patternid=group outside=cfreq
                inside=freq;
        run;
|

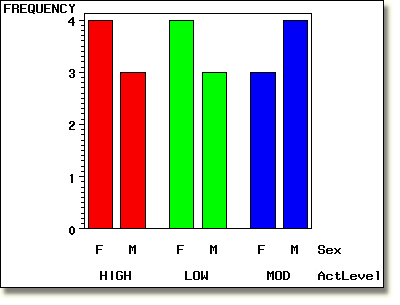
In contrast, the chart below shows the default behavior for VBAR charts.
Note that unlike horizontal bar charts, by default only one statistic is
displayed. proc gchart data=clinic.admit;
vbar sex / group=actlevel
patternid=group;
run;
|

|
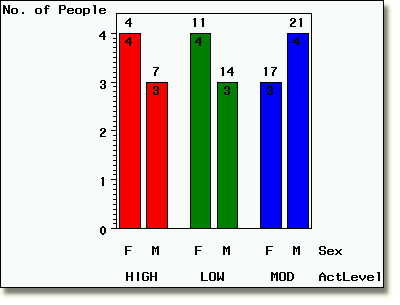
As with horizontal bar charts, you can label statistics on vertical bar charts. For example, the program below replaces the text for the statistic on the response (y) axis with the label specified in the AXIS statement. axis1 label=('No. of People');
proc gchart data=clinic.admit;
hbar sex / group=actlevel patternid=group
outside=cfreq inside=freq raxis=axis1;
run;
|

|
  |
|
Copyright © 2002 SAS Institute Inc., Cary, NC, USA. All rights reserved.