| You may want to use your SAS/GRAPH output in other applications.
To do so, you can export your SAS/GRAPH charts and plots to a variety of
file formats, including GIF, TIF, and PostScript.
You can export
- one chart or plot at a time interactively (in desktop operating environments). This
method is most useful for quickly exporting a few graphs.
To export SAS/GRAPH output interactively, you must create it as listing
output. If you specify only HTML output as a results preference,
the SAS/GRAPH output is created as a GIF image, but you cannot interactively
export it to other graphic file formats.
- any number of charts or plots using program statements.
This method is most useful for processing large quantities of output.
In addition, using program statements allows you to specify exactly
the device driver you want. This is therefore a more flexible and
powerful way of exporting SAS/GRAPH output.
Exporting SAS/GRAPH Output Interactively
After you create a graph or plot, you can export it interactively from either
the Graph window or from the Graphics Editor window. To export a graph from
one of these windows, follow these steps:
-
From the window where the graph is displayed, select
File
 Export as Image
-
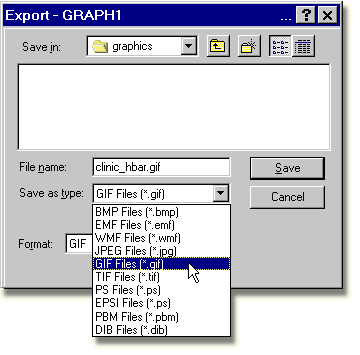
In the Export window, select a file type and specify a destination. Then
click Save or OK.
|


