| Creating Drill-Down Graphs in HTML |
| Creating the Initial Chart |
|
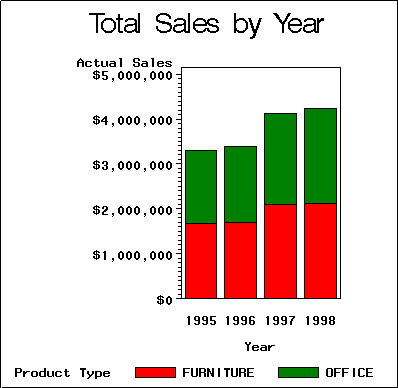
Your first step is to create the initial chart that you use as the primary chart in your linked series of graphs. In the lesson Creating Bar and Pie Charts, you learned how to use SAS/GRAPH software to produce charts. Let's assume that you have used the Finance.Prdsale2 data set to make a bar chart of sales ordered by product type and year: |
          data work.saletrnd;
             set finance.prdsal2;
             format actual dollar10.0;
          run;
          goptions hsize=5in vsize=4in;
          title 'Total Sales by Year';
          proc gchart data=work.saletrnd;
             vbar year / subgroup=prodtype discrete
                  sumvar=actual;
          run;
|

| Now that you've decided on the graph you want
to use, you're ready to add code to make a drill-down graph. The next step
is to add a variable to hold HTML link locations.
Let's see how you create the variable. |
  |
|
Copyright © 2002 SAS Institute Inc.,
Cary, NC, USA. All rights reserved.