| Creating Drill-Down Graphs in HTML |
| Creating the Secondary Charts and
Tables |
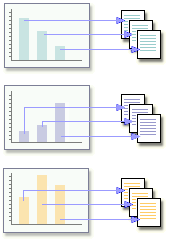
| With the secondary charts finished and their links in place, it's time to create the tables that show details for each quarter. Each set of tables is stored in the same HTML file as the secondary chart for the year. |


| In this example, we'll use PROC TABULATE to analyze quarterly sales and generate tables. However, you could link any type of SAS output to the secondary charts. |
| To learn more about PROC TABULATE, see the lesson Creating Tabular Reports. |
| Creating the Tables
Four PROC GCHART steps create the charts for annual sales. To create tables that show details for each quarter, do the following:
|
     ods html body='sales95.html';
     title 'Sales for 1995 by Quarter';
     proc gchart data=work.saletrnd;
        vbar quarter / sumvar=actual
             subgroup=product discrete
             html=secdrill;
        where year=1995;
     run;
|
| Here is the set of PROC TABULATE steps for each quarter of 1995 sales: |
     title '1st Quarter 1995 Sales by Country';
     proc tabulate data=work.saletrnd format=dollar10.0;
        class country product;
        var actual;
        table (country all)*(product all), sum*actual;
        where year=1995 and quarter=1;
     run;

     title '2nd Quarter 1995 Sales by Country';
     proc tabulate data=work.saletrnd format=dollar10.0;
        class country product;
        var actual;
        table (country all)*(product all), sum*actual;
        where year=1995 and quarter=2;
     run;

     title '3rd Quarter 1995 Sales by Country';
     proc tabulate data=work.saletrnd format=dollar10.0;
        class country product;
        var actual;
        table (country all)*(product all), sum*actual;
        where year=1995 and quarter=3;
     run;

     title '4th Quarter 1995 Sales by Country';
     proc tabulate data=work.saletrnd format=dollar10.0;
        class country product;
        var actual;
        table (country all)*(product all), sum*actual;
        where year=1995 and quarter=4;
     run;
|
  |
|
Copyright © 2002 SAS Institute Inc.,
Cary, NC, USA. All rights reserved.