| Creating Plots | |
| Creating a Basic Plot |
Let's start by using the GPLOT procedure to plot one variable
against another within a set of coordinate axes. You specify
|
General form, simple PROC GPLOT step:
PROC GPLOT DATA=SAS-data-set; where
|
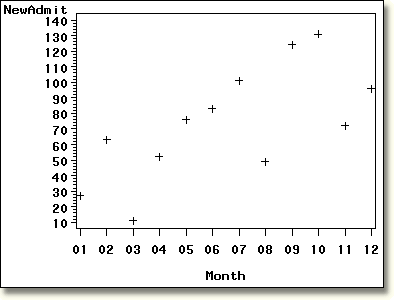
In the PROC GPLOT step below, the PROC GPLOT statement invokes
the procedure and names Clinic.Totals2000 as the data set
that contains the variables to be plotted. The PLOT statement specifies
NewAdmit as the vertical axis variable and Month
as the horizontal axis variable. |
     proc gplot data=clinic.totals2000;
        plot newadmit*month;
     run;
|
| The graph below is the output from the PROC GPLOT step above. The entire graph appears in one default color, and the default plotting symbols (plus signs) are not connected. |

  |
|
Copyright © 2002 SAS Institute Inc., Cary, NC, USA. All rights reserved.