| Creating Plots | |
| Lesson
Overview |
| Introduction
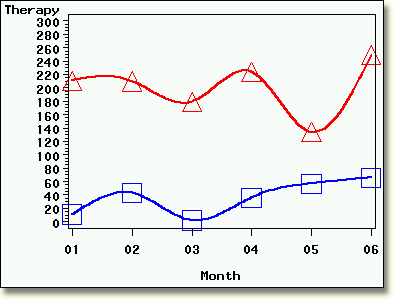
SAS/GRAPH software enables you to display your data graphically. To create a variety of plots, you can use the GPLOT procedure within SAS/GRAPH software. This lesson shows you how to create single plots and overlaid plots, then refine the plots by scaling axes, defining plotting symbols, and specifying methods of interpolating plotted points. You also learn different ways of viewing and storing graphs. |

| This lesson contains 41 pages and takes approximately 60-90 minutes to complete.
In this lesson, you learn how to
|
| Prerequisites Before taking this lesson, you should have completed the following lessons: Introduction to SAS Programming |
Copyright © 2002 SAS Institute Inc.,
Cary, NC, USA. All rights reserved.