| Creating Plots | |
| Scaling Axes |
| Range of Values
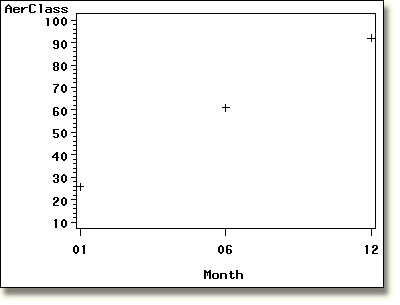
You can also scale axes by specifying a range of values. Notice the default scaling of the vertical axis in the plot below. |

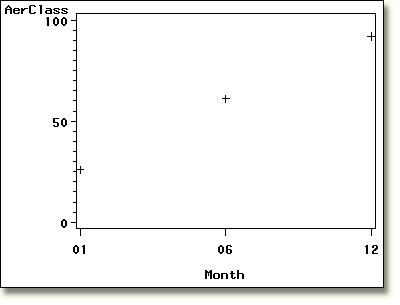
To scale the vertical axis from 0 to 100 in increments of
50, for example, you can use the VAXIS= option shown in the PROC GPLOT step
below.
proc gplot data=clinic.therapy1999; The modified vertical axis appears in the plot below. |

| When you specify a range of values, be sure to scale the axis in workable increments to accommodate the smallest and largest data values to be plotted. |
  |
|
Copyright © 2002 SAS Institute Inc., Cary, NC, USA. All rights reserved.