| Creating Plots | |
| Enhancing Plots |
| Now that you know how to create single and overlaid plots, you can use the SYMBOL statement to enhance your plots by specifying plotting symbols, plot lines, color, and interpolation. (Interpolation is a technique for estimating values between plot points and drawing lines to connect the points.) |
General form, SYMBOL statement:
where
|
| Several SYMBOL statement options are shown below. |
| This option ... | Specifies the ... |
|---|---|
| VALUE= | plotting symbol |
| HEIGHT= | height of the plotting symbol |
| INTERPOL= | interpolation technique |
| WIDTH= | thickness of the line in pixels |
| COLOR= | color of plotting symbols or lines |
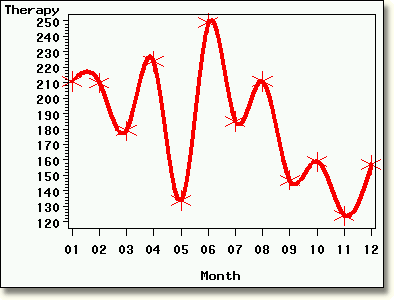
For example, the SYMBOL1 statement below specifies that
     symbol1 color=red value=star interpol=spline
             height=1 cm width=4;
     proc gplot data=clinic.totals2000;
        plot therapy*month;
     run;
The PROC GPLOT step produces the plot below. |

  |
|
Copyright © 2002 SAS Institute Inc.,
Cary, NC, USA. All rights reserved.