| Creating Plots | |
| Enhancing Plots |
| Specifying SYMBOL Statements
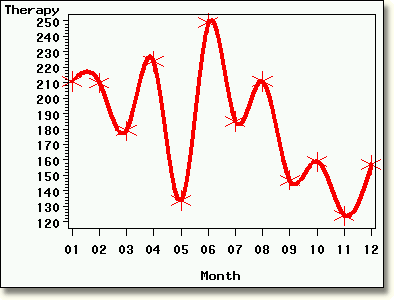
You can specify a single SYMBOL statement to enhance a specific plot line, as shown below . . . symbol1 color=red value=star interpol=spline
height=1 cm width=4;
proc gplot data=clinic.totals2000;
plot therapy*month;
run;
|

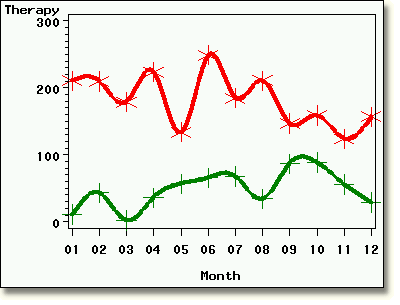
| . . . or you can specify multiple SYMBOL statements to control several plot lines. |
     symbol1 color=red value=star interpol=spline
             height=1 cm width=4;
     symbol2 color=green value=plus interpol=spline
             height=1 cm width=4;
     proc gplot data=clinic.totals2000;
        plot therapy*month treadmill*month / overlay;
     run;
|

| Let's look at SYMBOL statement options in detail. |
  |
|
Copyright © 2002 SAS Institute Inc., Cary, NC, USA. All rights reserved.