SAS OnlineTutor HomeFAQ PageSuggested Learning PathsContents+Searchback||next

Creating Plots
Enhancing Plots


Setting Plotting Symbols

The VALUE= (or V=) option specifies the plotting symbol that represents each data point. Possible values for the VALUE= option include

  • the letters A through W
  • the numbers 0 through 9
  • a number of special symbols including PLUS, STAR, SQUARE, DIAMOND, TRIANGLE, and many others
  • NONE, which produces a plot with no symbols for data points.
Note: For a complete list of plotting symbol values, see SAS/GRAPH Software: Reference.

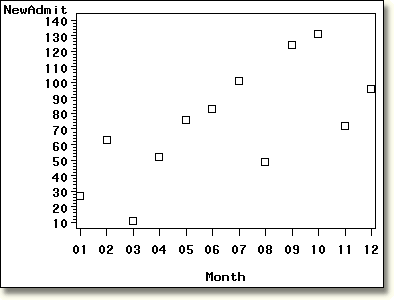
In the PROC GPLOT step below, the SYMBOL1 statement specifies the SQUARE plotting symbol.

     symbol1 value=square color=black; 
     proc gplot data=clinic.totals2000;
        plot newadmit*month; 
     run;

Plot with v=square.


back||next


Copyright © 2002 SAS Institute Inc., Cary, NC, USA. All rights reserved.

Terms of Use & Legal Information | Privacy Statement