| Creating Plots | |
| Additional Features |
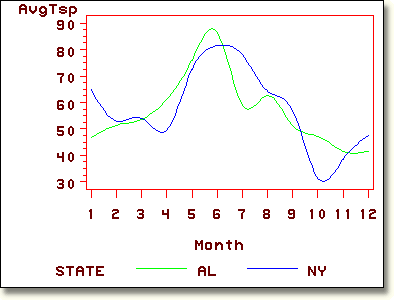
The CAXIS= and CTEXT=
options enable you to specify color for axes and text in plots. symbol1 color=green interpol=spline value=none;
symbol2 color=blue interpol=spline value=none;
proc gplot data=air.airqual;
plot avgtsp*month=state / vminor=3
hminor=0 ctext=brown caxis=red;
where state in ("AL" , "NY");
run;
|
You can use the AREAS= option to fill the
areas below plotted lines, PATTERN statements to define
the fill colors, and NOTE statements to identify the data.
The legend in this example has been suppressed with a
NOLEGEND option because the NOTE statement identifies the
data.
     proc gplot data=air.airqual;
        plot avgtsp*month=state /
             vminor=3 hminor=0 areas=2 nolegend;
        pattern1 color=red;
        pattern2 color=blue;
        note move=(10, 19) color=red 'Alabama';
        note move=(10, 20) color=blue 'California';
        symbol1 c=red i=spline v=none;
        symbol2 c=blue i=spline v=none;
        where state in ("CA" , "AL");
     run;
|

| Other SAS/GRAPH Features
In addition to the capabilities of the GPLOT procedure, SAS/GRAPH software enables you to
and much more. |
  |
|
Copyright © 2002 SAS Institute Inc.,
Cary, NC, USA. All rights reserved.