| Creating Bar and Pie Charts |
| Enhancing
Charts |
| You've learned how to create any basic bar or pie chart.
But you may also want to enhance your charts by specifying
patterns other than the default values for bars or slices.
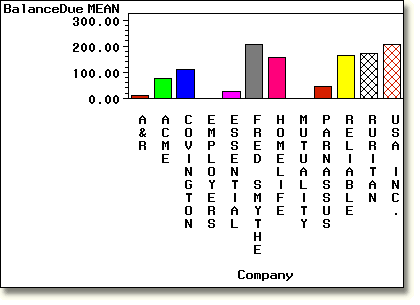
The default fill for horizontal and vertical bar charts specifies that all bars will be the same solid color. To change the default values for bar charts, you use the PATTERNID= option in the statement that specifies the chart. This topic focuses on PATTERNID=MIDPOINT, which specifies a different color/pattern combination for each bar. |
General form, PATTERNID= option:
where
|
| Example
This program shows the effect of the PATTERNID=MIDPOINT option on bar color and fill patterns. proc gchart data=clinic.insure;
vbar company / sumvar=balancedue type=mean
patternid=midpoint;
run;
|

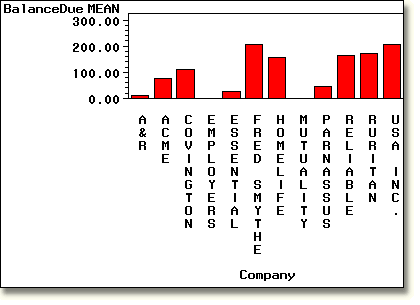
For comparison, the GCHART procedure below shows the default
bar color and fill pattern.
     proc gchart data=clinic.insure;
        vbar company / sumvar=balancedue type=mean;
     run;
|

  |
|
Copyright © 2002 SAS Institute Inc.,
Cary, NC, USA. All rights reserved.