| Creating Bar and Pie Charts |
| Enhancing
Charts |
| Another aspect of charts that you can modify is the
fill for pie slices. By default, pie charts start with a
solid fill, rotating through the colors in the
color list once. If there are additional
slices, the fill changes to the next pattern in the list and rotates through
the color list again.
To change the fill pattern to either all solid or all hatch, you can use the FILL= option in the PIE or PIE3D statement. |
General form, FILL= option:
where
|
| Example
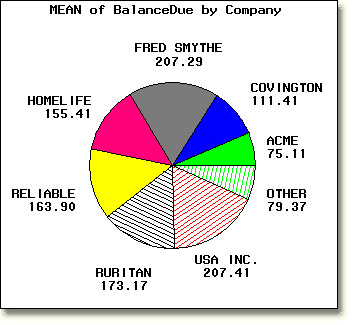
This program shows the default color and fill pattern for pie charts. Note that both solid and hatch patterns are used. proc gchart data=clinic.insure;
pie company / sumvar=balancedue type=mean;
run;
|

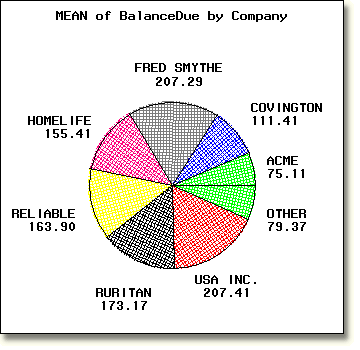
The program below shows how the FILL=X
option changes the slice patterns. Only one hatch pattern is used,
and it rotates through the color list. Note that one color (green) is used
twice because there were not as many colors in the color list as there are
slices in the chart (some colors were assigned to companies with no balance
due or companies included in OTHER).
     proc gchart data=clinic.insure;
        pie company / sumvar=balancedue type=mean fill=x;
     run;
|

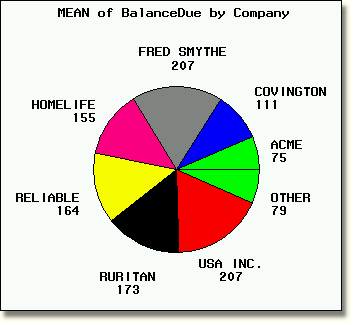
This program shows how the FILL=S option
changes the slice patterns to solid fill.
     proc gchart data=clinic.insure;
        pie company / sumvar=balancedue type=mean fill=s;
     run;
|

  |
|
Copyright © 2002 SAS Institute Inc.,
Cary, NC, USA. All rights reserved.