| Creating Bar and Pie Charts | |
| Viewing and Storing Charts |
As you create charts, you may want to manage them. For example,
you can
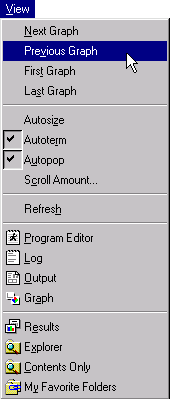
In this lesson, you have viewed charts in the GRAPH window. To scroll through all the graphs created in a SAS session, you can
|

| Viewing Graphs Using the Results Window
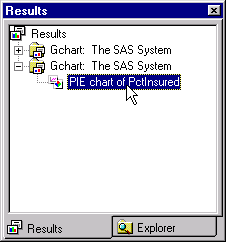
In the lesson Working in the SAS Environment, you learned how to view, save, print, and delete individual items of output using the Results window. To view any graph, expand folders in the Results window and double-click the item for the graph (such as PIE chart of PctInsured below). |

| The graph is displayed in the GRAPH window. |
  |
|
Copyright © 2002 SAS Institute Inc., Cary, NC, USA. All rights reserved.