| Enhancing and Exporting Charts and Plots |
| Sizing Graphs
|
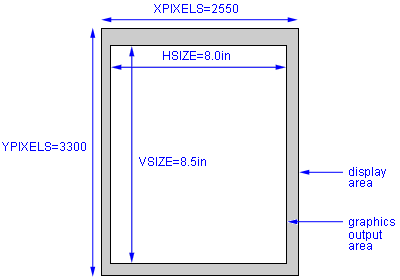
| When you create charts and plots, you may want to specify
the size of the overall graph and even add a border around the graph. To
do so, you specify options for controlling the height, width, and border
in the GOPTIONS statement.
The way you create the graph determines how you size it:
|

| Let's see how the two pairs of options work |
  |
|
Copyright © 2002 SAS Institute Inc.,
Cary, NC, USA. All rights reserved.