| Enhancing and Exporting Charts and Plots |
| Sizing Graphs
|
| Using the HSIZE= and VSIZE= Options
If you create your graph in the GRAPH window, use the HSIZE= and VSIZE= options to size your graph. The HSIZE= option specifies the width of the graphics output area, and the VSIZE= option specifies the height of the graphics output area. |
General form, HSIZE= and VSIZE= options:
where horizontal-size and vertical-size are a positive number and may be followed by a unit specification, either IN for inches (default), CM for centimeters, or PT for points. The default unit is IN. |
For example, the GOPTIONS statement below specifies both
a height and width of 5 inches. To add a border around the graph, use the
BORDER option.
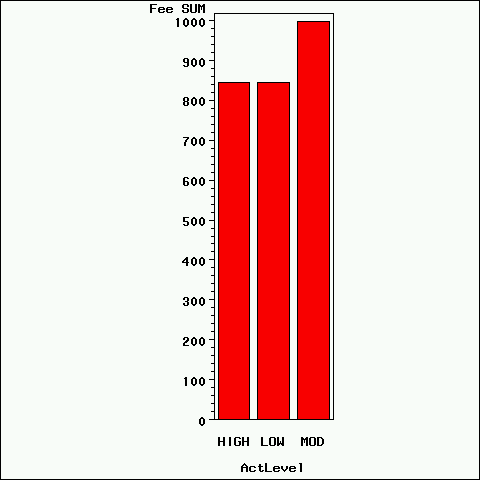
goptions hsize=5in vsize=5in border; The program creates the following bar chart. The border outlines the graphics output area defined by HSIZE= and VSIZE=. |

  |
|
Copyright © 2002 SAS Institute Inc.,
Cary, NC, USA. All rights reserved.