SAS OnlineTutor HomeFAQ PageSuggested Learning PathsContents+Searchback||next

Enhancing and Exporting Charts and Plots
Sizing Graphs


Sizing Graphs for Export

When you create graphs using HSIZE= and VSIZE=, the display area and the graphics output area may not be the same size. When you simply view the graph, this is not a problem, but the difference may show up when you export the graph.

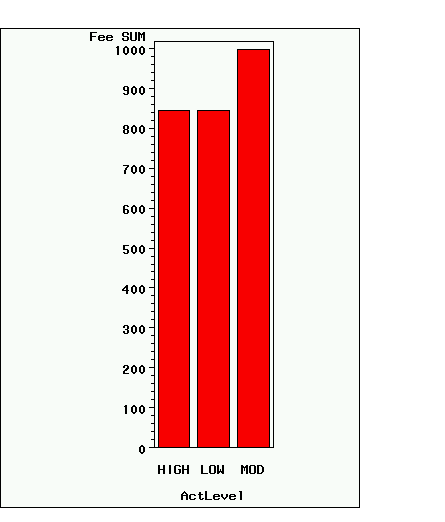
For example, depending on your display, a graphic may look like the one below when exported. Notice that the graphics output area defined by HSIZE= and VSIZE= is not necessarily the entire display area. (The display area has been grayed to distinguish it from the graphics output area.)


Graph with display area larger than graphics output area


To export a graph sized exactly as specified by HSIZE= and VSIZE=, follow these steps:
  1. Create the graph in the GRAPH window. It's useful to add a border so that you can see the exact graphics output area.

  2. Size the GRAPH window to the approximate size of the graphic. (The entire graphic may not be visible as you resize the window.)

  3. Recall and re-submit the SAS/GRAPH program.

  4. Adjust the size of the GRAPH window until no display area appears between the border of the graph and the window border.

  5. Issue the WSAVE command to save the dimensions of the GRAPH window.

  6. Recall and re-submit the SAS/GRAPH program to create the graph in the newly sized GRAPH window.

  7. Export the graph.


Note: This process involves several steps, but it is useful when you want to export more than one graph of the same size interactively.


back||next


Copyright © 2002 SAS Institute Inc., Cary, NC, USA. All rights reserved.

Terms of Use & Legal Information | Privacy Statement