| Creating Drill-Down Graphs in HTML |
| Attaching Links to the Primary Chart |
| You've already created the initial chart you want to use. Now it's time to modify the code for the chart to create the primary chart and attach links to it. |
| First, let's look at the code that created the chart you are using: |
goptions hsize=5in vsize=4in;
title 'Total Sales by Year';
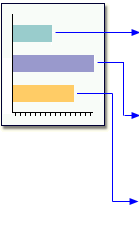
proc gchart data=work.saletrnd;
vbar year / subgroup=prodtype discrete
sumvar=actual;
run;
|
| To create the drill-down graph, change the GOPTIONS statement to specify GIF output and a size for the SAS/GRAPH chart. |
goptions device=gif xpixels=480 ypixels=360; |
Next, add the HTML= option to the VBAR statement. The
HTML= option assigns elements of the chart to the variable you created
to hold the HREF address strings (PriDrill). In turn, the
HTML= variable identifies the link destination variable
to the GRAPH procedure for use in creating the image map in the HTML output
file. |
     goptions device=gif xpixels=480 ypixels=360;
     title 'Total Sales by Year';
     proc gchart data=work.saletrnd;
        vbar year / subgroup=prodtype discrete
             sumvar=actual html=pridrill;
     run;
|
  |
|
Copyright © 2002 SAS Institute Inc.,
Cary, NC, USA. All rights reserved.