| Creating Drill-Down Graphs in HTML |
| Attaching Links to the Primary Chart |
| Checking Your Progress
Your program has now progressed far enough to generate an HTML page and chart. The chart's links lead to pages that do not yet exist, but you can check on the appearance of your work to this point. After the RUN statement that completes your PROC GCHART step, add a QUIT statement and close ODS HTML. quit;
ods html close;
ods listing;
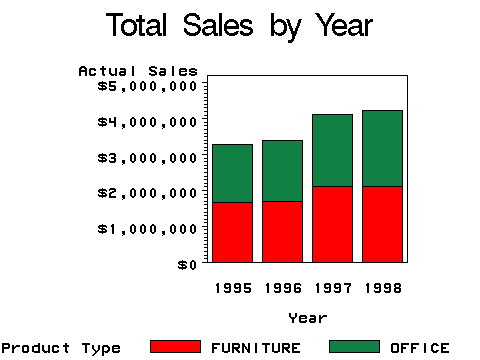
In our example, these modifications result in the interim program below, which creates an HTML page, totsales.html, displaying the GIF image that follows. (Because the secondary files haven't been created yet, the links from the chart bars below have been removed.) |
data work.saletrnd;
set finance.prdsal2;
length PriDrill $ 40;
if year=1995 then pridrill='HREF="sales95.html"';
if year=1996 then pridrill='HREF="sales96.html"';
if year=1997 then pridrill='HREF="sales97.html"';
if year=1998 then pridrill='HREF="sales98.html"';
format actual dollar10.0;
run;
ods listing close;
ods html path='c:\data\sales\reports'
body='totsales.html';
goptions device=gif xpixels=480 ypixels=360;
title 'Total Sales by Year';
proc gchart data=work.saletrnd;
vbar year / subgroup=prodtype discrete
sumvar=actual html=pridrill;
run;
     quit;
     ods html close;
     ods listing;
|

  |
|
Copyright © 2002 SAS Institute Inc.,
Cary, NC, USA. All rights reserved.