| Creating Drill-Down Graphs in HTML |
| Creating the Secondary Charts and
Tables |
| With the primary chart finished and its links in place, it's time to create the secondary charts that show details for each sales year. |
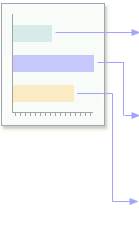

Remember that the bars in your primary chart are linked to pages by the
values defined for PriDrill. |
     if year=1995 then pridrill='HREF="sales95.html"';
     if year=1996 then pridrill='HREF="sales96.html"';
     if year=1997 then pridrill='HREF="sales97.html"';
     if year=1998 then pridrill='HREF="sales98.html"';
|
| Now you need to create sales95.html, sales96.html, and so on. Continue as before, using ODS HTML statements to write the HTML pages and PROC GCHART steps to create the GIF charts. Since each chart must show sales for only one year, use a WHERE statement within each PROC GCHART step to limit its data to a specific year. |
ods html body='sales95.html';
title 'Sales for 1995 by Quarter';
proc gchart data=work.saletrnd;
vbar quarter / sumvar=actual
|
| Note that each graph gets a new TITLE statement. The net result is a set of pages displaying the graphs shown at half-size below. |
sales95.html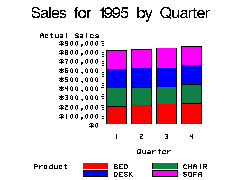 |
sales96.html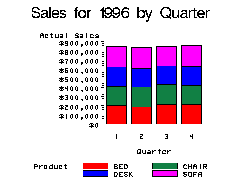 |
||
sales97.html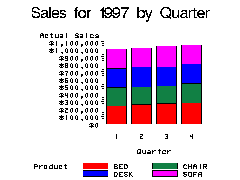 |
sales98.html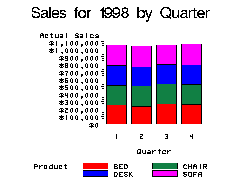 |
  |
|
Copyright © 2002 SAS Institute Inc.,
Cary, NC, USA. All rights reserved.