| Creating Drill-Down Graphs in HTML |
| Creating the Secondary Charts and
Tables |
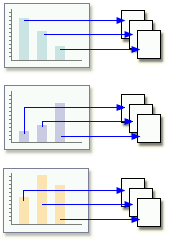
| Now you can link the bars on your secondary charts to tables that hold summary data for each quarter. This time, instead of pointing to separate HTML files, the links point to HREF anchors further down the same page. |


| Creating the Anchor Links
As with the previous links, you start by creating a variable for storing the HREF locations.
|
     data work.saletrnd;
        set finance.prdsal2;
     length PriDrill $ 40 SecDrill $ 40;
     if year=1995 then pridrill='HREF="sales95.html"';
     if year=1996 then pridrill='HREF="sales96.html"';
     if year=1997 then pridrill='HREF="sales97.html"';
     if year=1998 then pridrill='HREF="sales98.html"';
     if quarter=1 then secdrill='HREF="#salesq1"';
     if quarter=2 then secdrill='HREF="#salesq2"';
     if quarter=3 then secdrill='HREF="#salesq3"';
     if quarter=4 then secdrill='HREF="#salesq4"';
|
|
     ods html body='sales95.html';
     title 'Sales for 1995 by Quarter';
     proc gchart data=work.saletrnd;
        vbar quarter / sumvar=actual
             subgroup=product discrete
             html=secdrill;
        where year=1995;
     run;

     ods html body='sales96.html';
     title 'Sales for 1996 by Quarter';
     proc gchart data=work.saletrnd;
        vbar quarter / sumvar=actual
             subgroup=product discrete
             html=secdrill;
        where year=1996;
     run;

     ods html body='sales97.html';
     title 'Sales for 1997 by Quarter';
     proc gchart data=work.saletrnd;
        vbar quarter / sumvar=actual
             subgroup=product discrete
             html=secdrill;
        where year=1997;
     run;

     ods html body='sales98.html';
     title 'Sales for 1998 by Quarter';
     proc gchart data=work.saletrnd;
        vbar quarter / sumvar=actual
             subgroup=product discrete
             html=secdrill;
        where year=1998;
     run;
|
| If you want, you can view an annotated version of the example program so far. |
  |
|
Copyright © 2002 SAS Institute Inc.,
Cary, NC, USA. All rights reserved.